- Eligibility
- Basic Technical Analysis
- Language
- English, Hindi, Bengali
- Learning Mode
- Online Classroom
- Duration
- 3 Months
- Faculty
- Mr. Susanta Malik

5 (44 Rating) 87 Students Enrolled
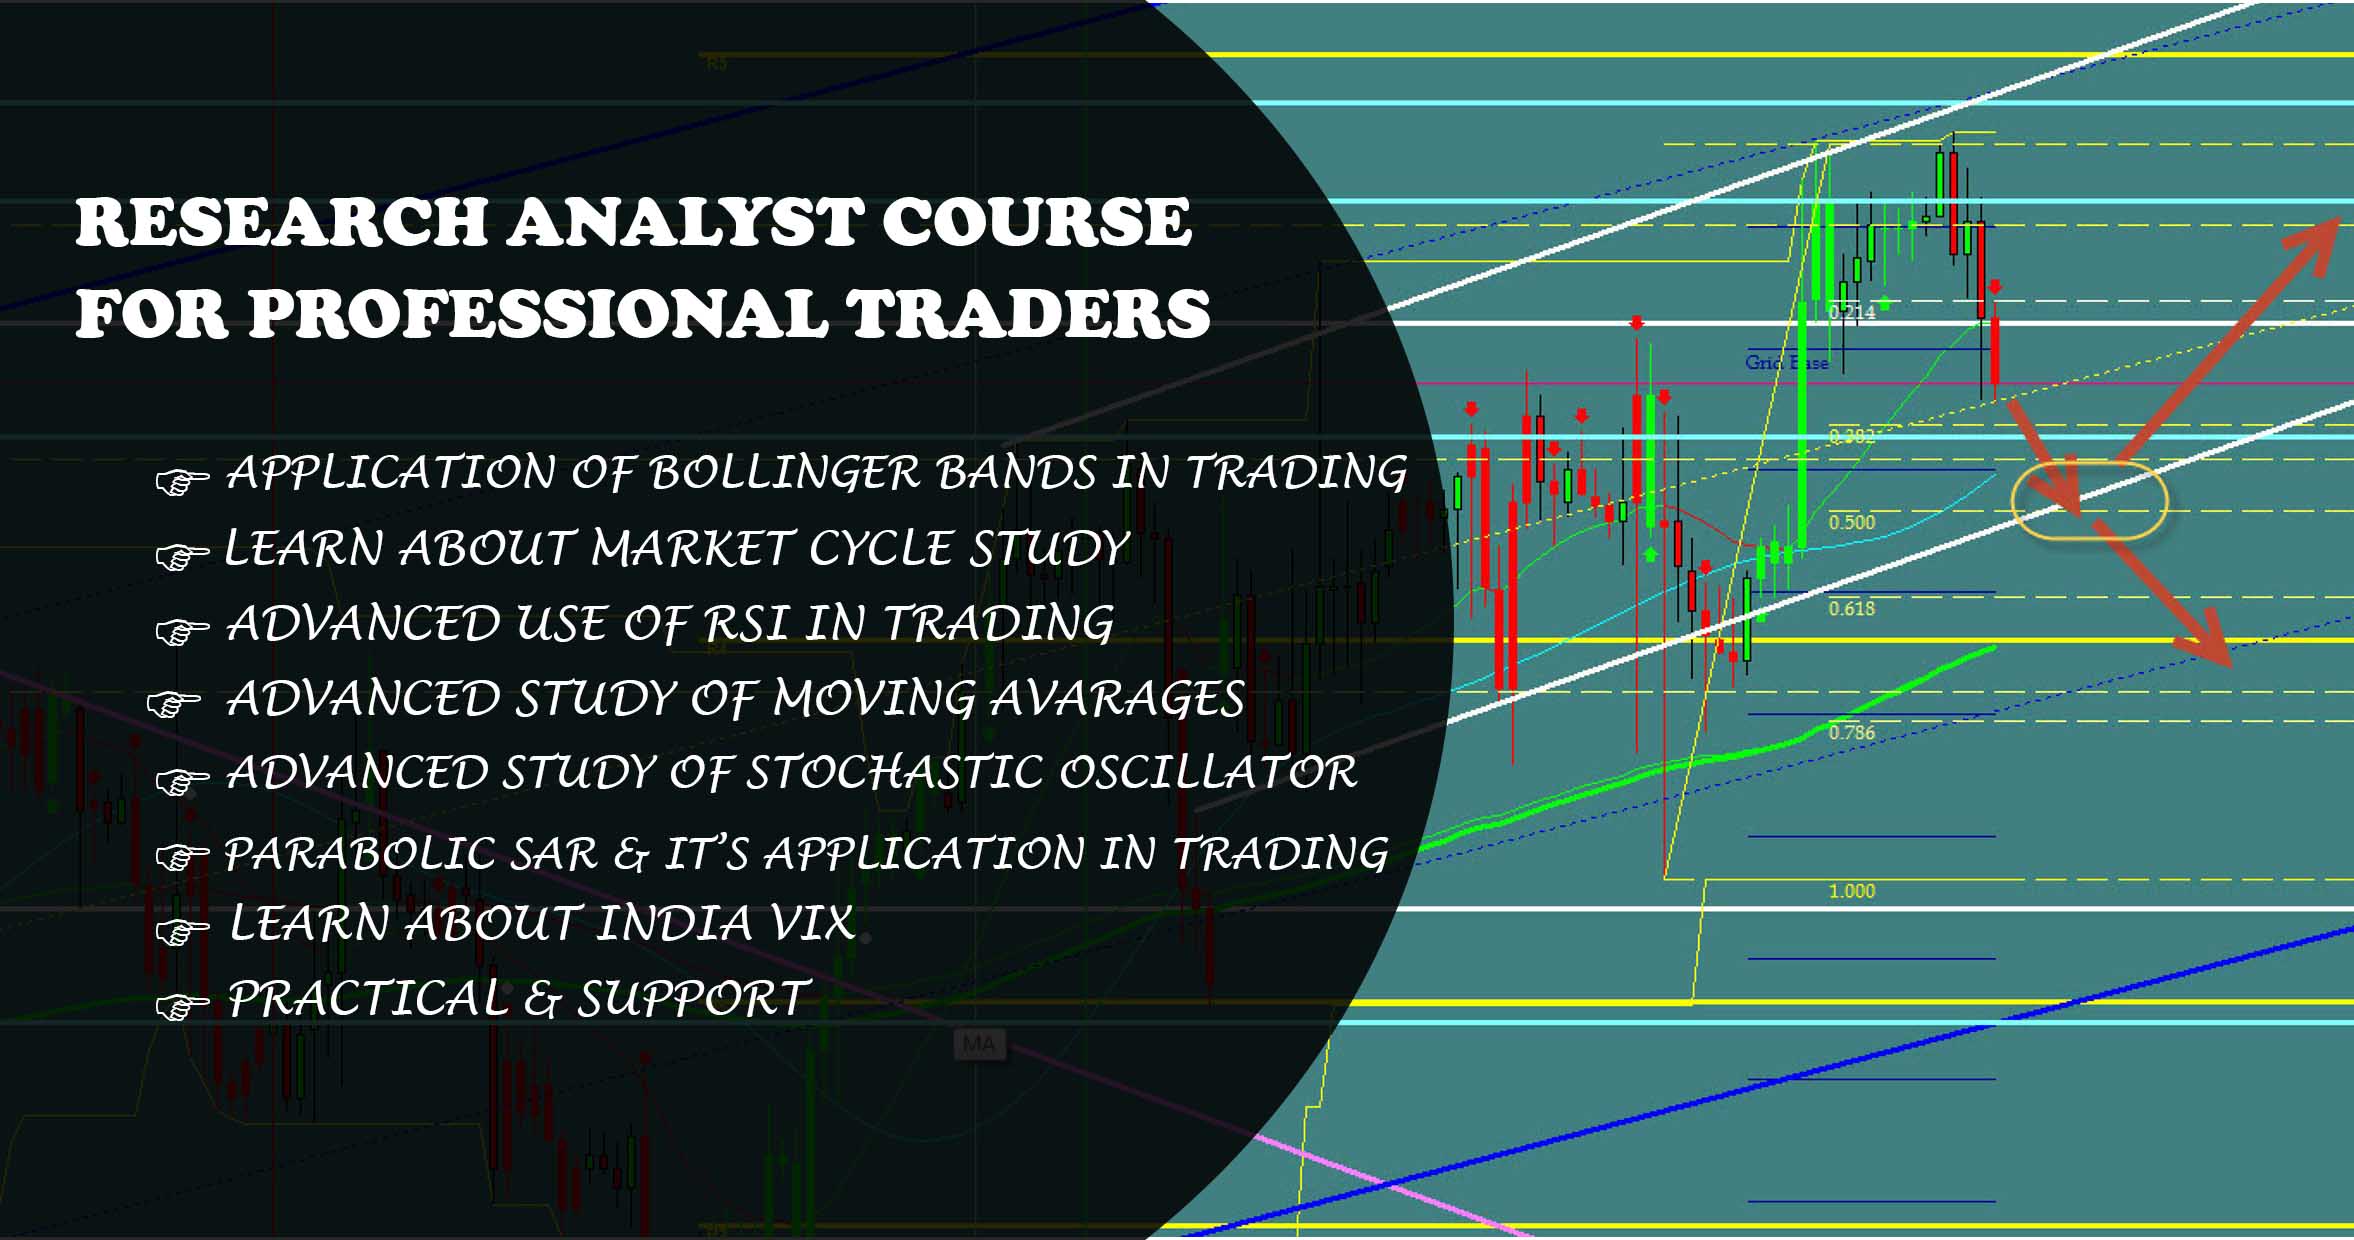
The research means the systematic investigation as well as the study of sources or material or things so that the facts can be established or the conclusion can be drawn. So you have enough knowledge then you can do research on the market with our modern technicals & became a good quality analyst. Friends we only train those persons who have already got training our prior technical analysis course or they have sound knowledge on TA(EQUITY, COMMODITY market). Volatility is expected to continue, after rate hikes by the U.S. Federal Reserve, Brexit developments and higher crude oil prices. Indian equity markets are expected to face multiple headwinds despite a global macro upswing, strong flows, higher private CapEx, normalization post-GST, and demonetization, and a favorable political backdrop. If this type of situation will occur in the market then only a research analyst can trade to use our high-quality TA (MODERN & RECTIFIED ) course.
Intended Participants
What is cycle study?
From the changing seasons to the different stages of our lives, cycles exist all around us. These cycles are often influenced by numerous factors at each stage. Likewise, cycles also affect the movements of stocks in the market. Understanding how these movements work can help a trader to identify new trading opportunities and lower their risk. So markets are usually influenced 4 business cycle.INCEPTION, GROWTH, MATURITY, SATURATION & DECLINE.
What is RSI?
The relative strength index (RSI) is a technical indicator used in the analysis of financial markets.
What is advance RSI?
The RSI is more than the momentum oscillator from which market overbought & oversold conditions can be identified. The indicator has the ability to forecast future market level from specific pattern, that is advance study.
What is Range?
Range defines the price spread for a defined period, such as a day, month or year, and indicates the security’s price volatility.
What is shift of range ?
An oscillator is an indicator that fluctuates above and below a centerline or between set levels as its value changes over time. Oscillators can remain at extreme levels (overbought or oversold) for extended periods, but they cannot trend for a sustained period.
What is bulls power& Bear power ?
The Bull and Bear Power oscillators developed by Dr Alexander Elder attempt to measure the power of buyers (bulls) and sellers (bears) to push prices above and below the consensus of value.
What is india vix ?
India VIX is a volatility index which measures market expectations of near term volatility .Volatility index is also referred to as the Fear Gauge and is used by traders/investors to make their trading/investment decision.
Which indicator measure speculation in stock market ?
In finance, speculation is also the practice of engaging in risky financial transactions in an attempt to profit from short term fluctuations in the market value of a tradable financial instrument—rather than attempting to profit from the underlying financial attributes embodied in the instrument such as capital gains, dividends, or interest. I think hedging is the most effective tools in stock market.
What is pivot ?
By definition, a pivot point is a point of rotation.
This Pivot Points Calculation For Trading resistance and support level is highly useful to anyone involved in online forex trading, option trading, fx options, online future trading. Using this pivot points calculator, the idea of trading and the idea of where the market is heading during the course of the day can be got with only a few simple calculations.
Is there any relation between pivot point & FIBONACCI series ?
Fibonacci pivot point levels are determined by first calculating the pivot point like you would the standard method.
What is moving average ?
A moving average (MA) is a widely used indicator in technical analysis that helps smooth out price action by filtering out the “noise” from random short-term price fluctuations.
What is parabolic sar ?
Parabolic sar is basicaly curved line which during an uptrend moves below according to the price movement & during downtrend it is ploted on the heigh of the price. It works as line of control .