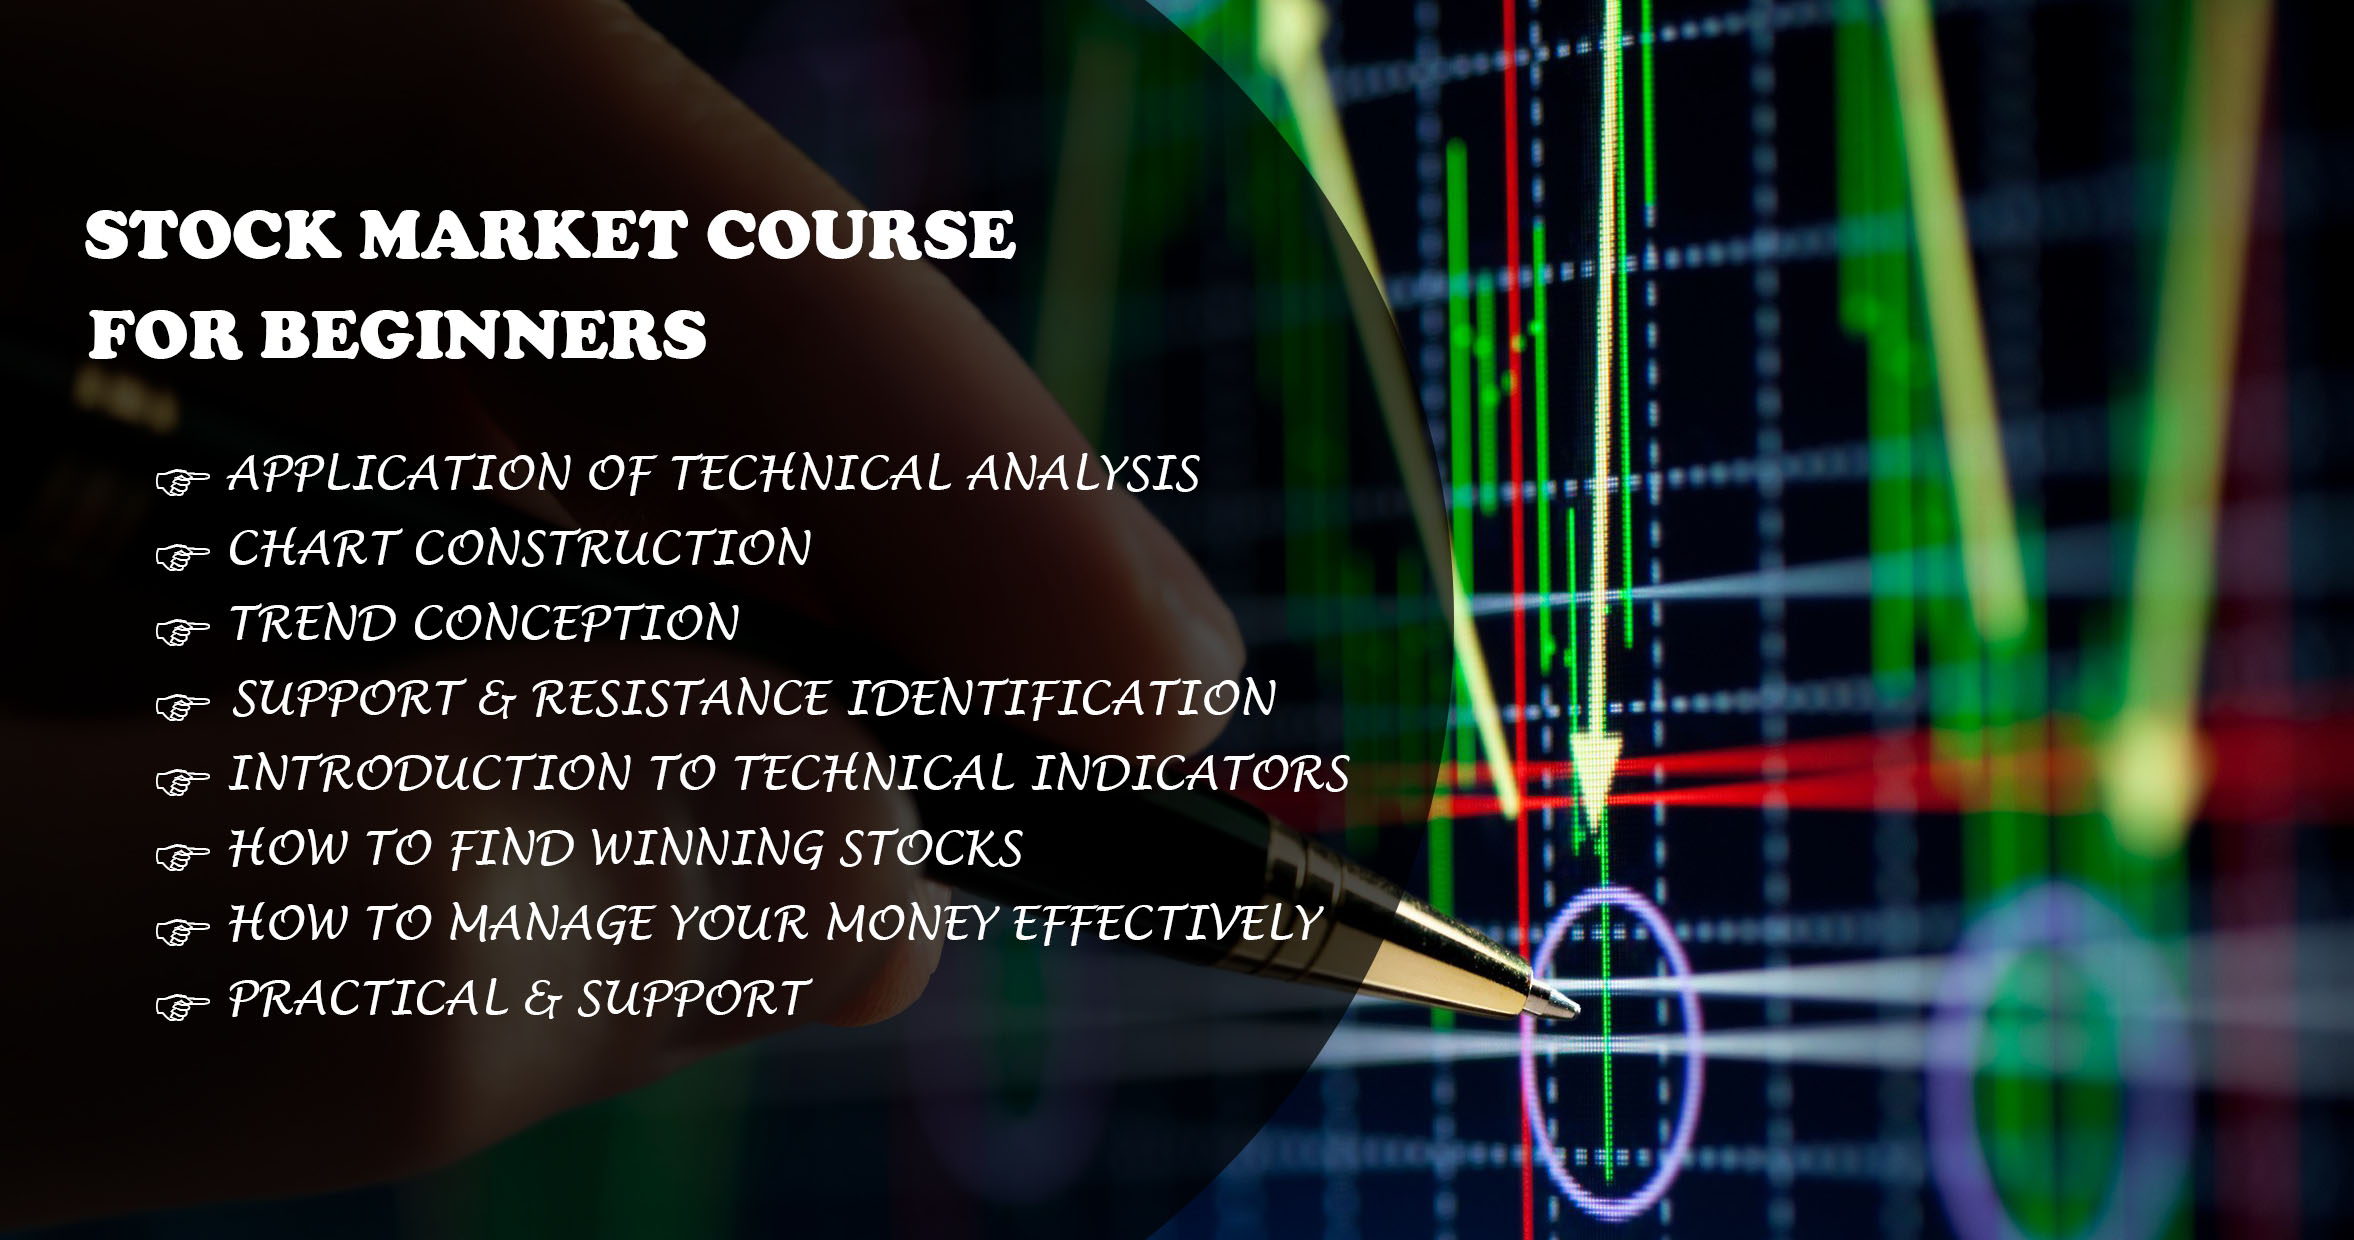
- Eligibility
- 10+2 Passed
- Language
- English, Hindi, Bengali
- Learning Mode
- Online Classroom
- Duration
- 3 Months
- Faculty
- Mr. Susanta Malik

5 (92 Rating) 253 Students Enrolled
As a trader or an investor, you would have experienced that when you buy a stock, the price goes down and the day when you sell the stock, the price starts moving up. Along with this, whenever you place a stop loss, it gets triggered and then the price goes in your desired direction. With our extensive experience in Stock & commodity market, we have to develop this remarkable course.
This Course will help you a long-term & short-term investment for a long time without getting any help from others.
Intended Participants
What is the importance of technical analysis?
The Purpose of Technical Analysis. The purpose of technical analysis is to carry out price forecasts. By processing historical market data of any instrument, you can try to anticipate how it should be traded,( EQUITY, COMMODITY, CURRENCY ).
Why should you learn from SmalikAdvisory?
Friends technical analysis is a subject which was discovered in the western country before many years, But only we know this is behavioral science. A lot of practice & application was done by us in the Indian market. Only we can apply it the right way on these high-risk market. Not only that but also only we know how to use various technical tools at the right time at the right moment. We know how to price behavior can act in a different country through different psychological change. Which is called shift of demand and supply ratio? So our goal is to know you how to use market momentum on your trading & investment portfolio. Only we can train you on how to choose stock like a smart trader.
What has the technical analysis tool done?
Our Technical Analysis tool is the forecasting of future financial price movements based on an examination of past price movements. Instead, this tool can help investors anticipate what is “likely” to happen to prices over time. Technical analysis uses a wide variety of charts that show price over time.