- Eligibility
- Basic Technical Analysis
- Language
- English, Hindi, Bengali
- Learning Mode
- Online Classroom
- Duration
- 3 Months
- Faculty
- Mr. Susanta Malik

5 (77 Rating) 182 Students Enrolled
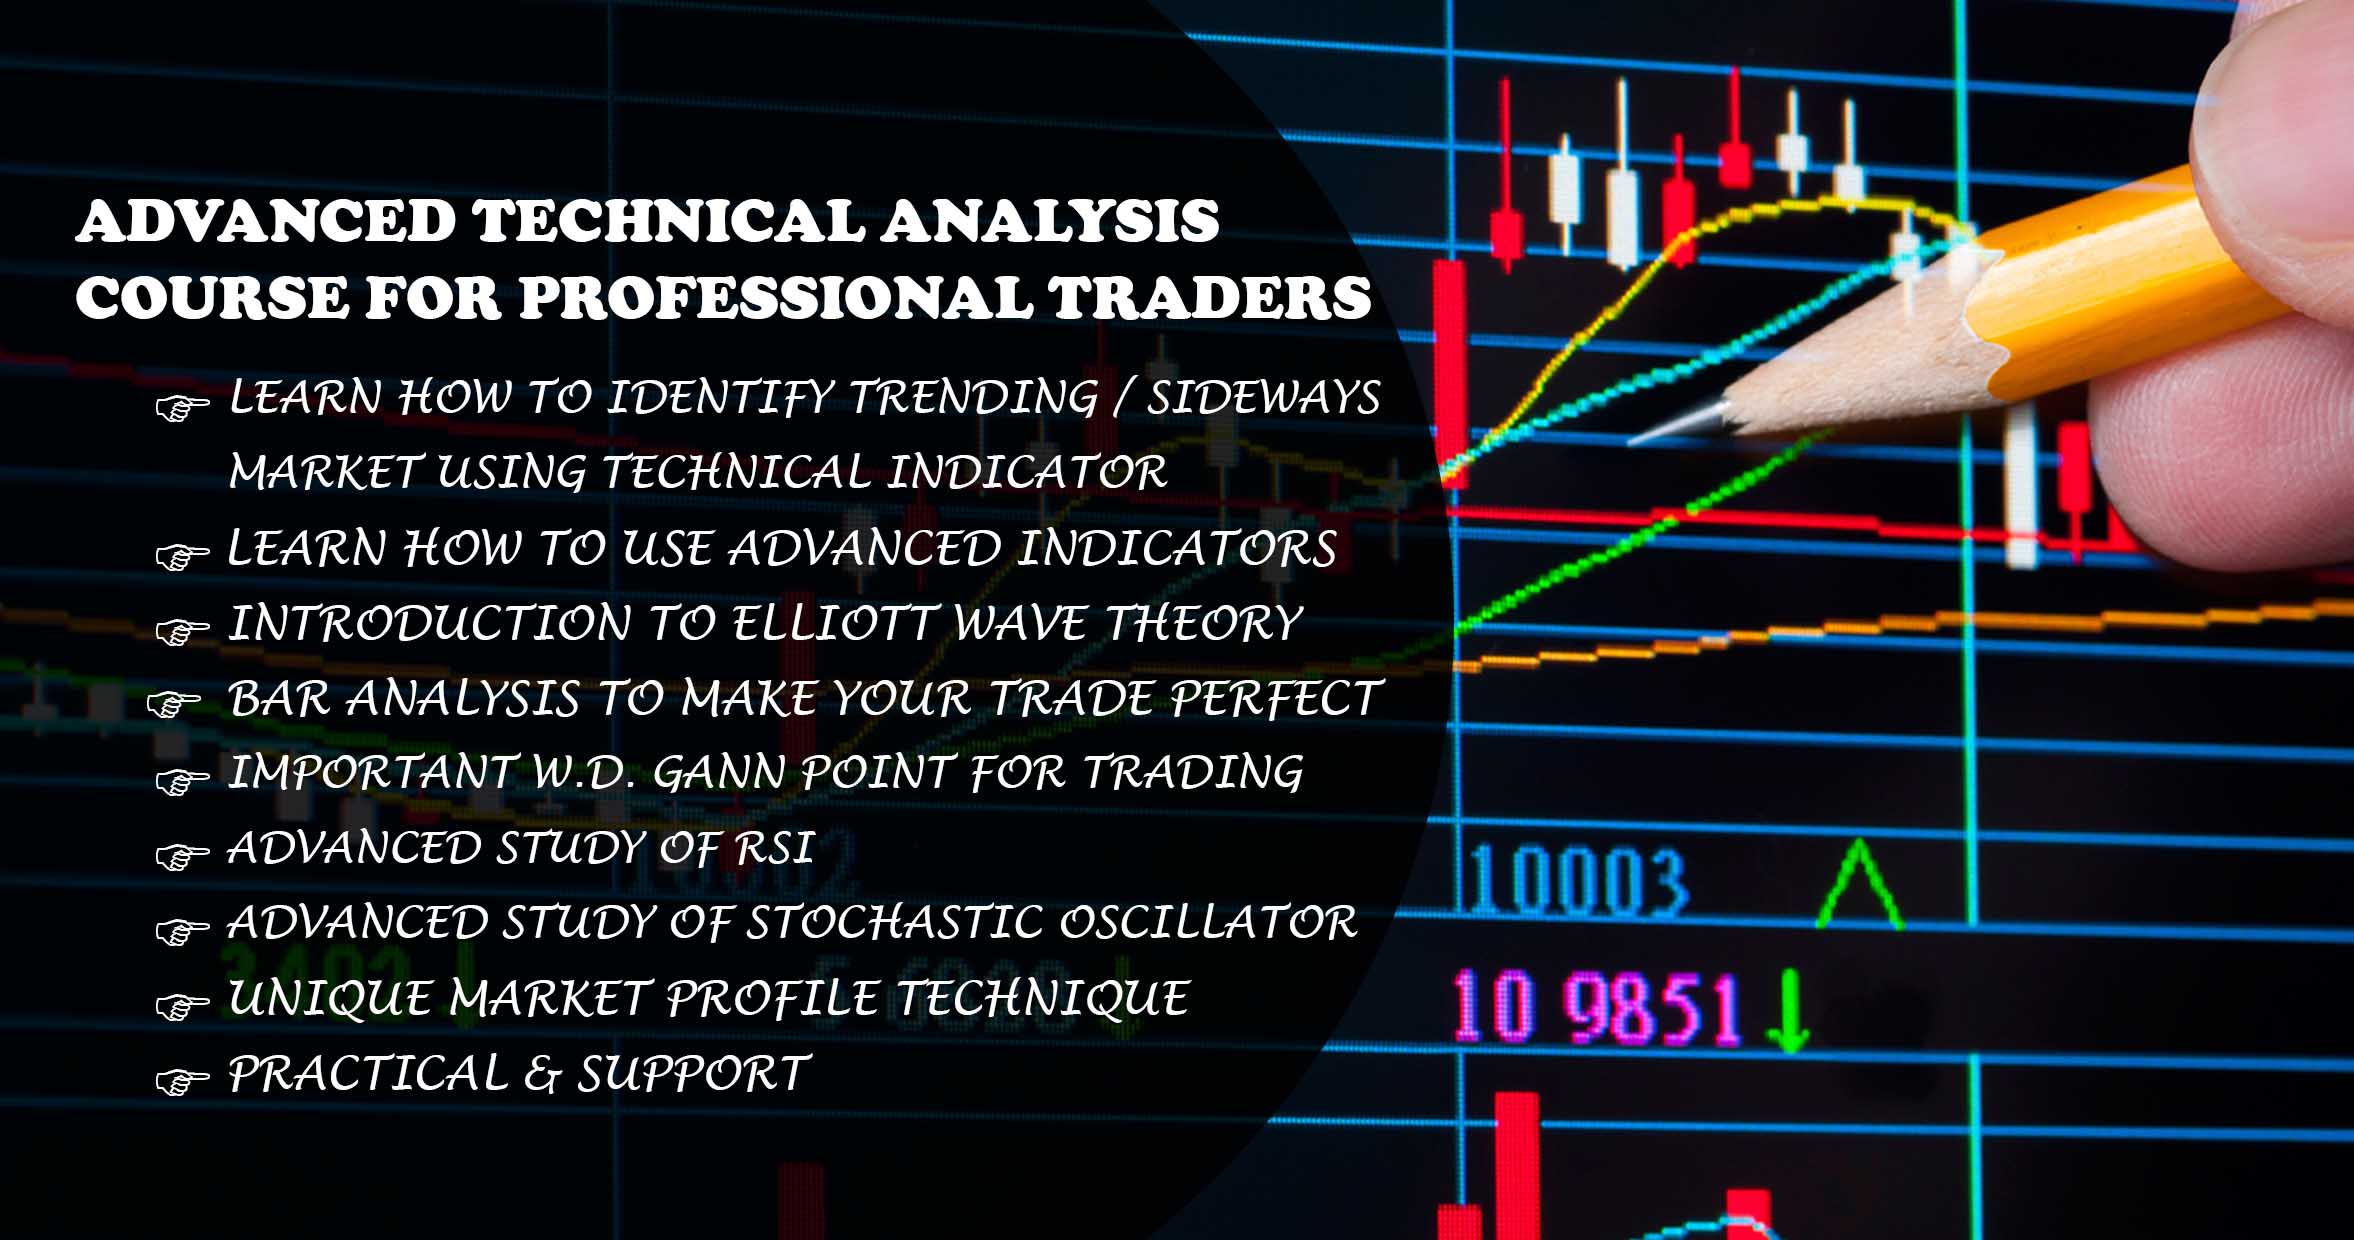
Learn to capitalize on trends like a professional trader using advanced technical indicators and chart analysis. If you want to capture price movements like a professional trader, then you need to become an expert at spotting and analyzing technical cues.
SMALIK ADVISORY training programme has once again partnered with JC Parets to bring you Advanced Technical Analysis, an extensive course focusing on complex techniques that divide the amateurs from the professionals.
Intended Participants
What is RSI?
The relative strength index (RSI) is a technical indicator used in the analysis of financial markets. It is intended to chart the current and historical strength or weakness of a stock or market based on the closing prices of a recent trading period.
Is RSI good indicator?
RSI (Relative Strength Index) is counted among trading’s most popular indicators. This is for good reason because as a member of the oscillator family, RSI can help us determine the trend, time entries, and more. RSI oscillates and is bound between zero and 100.
What is the Directional Movement System?
The Directional Movement System is a fairly complex indicator developed by Welles Wilder and explained in his book, New Concepts in Technical Trading Systems. The Average Directional Movement Index (ADX) indicates whether the market is trending or ranging.
Why market falls faster than rising?
Due to fear of retail traders and heavy selling / shorting by FII, DII & HNI clients in the market.
What is William %R?
Williams %R, also known as the Williams Percent Range, is a type of momentum indicator that moves between 0 and -100 and measures overbought and oversold levels. The Williams %R may be used to find entry and exit points in the market.